
Yesterday saw the release of two important US unemployment statistics - the ADP Jobs Report and the Weekly Unemployment Claims.
USING UNEMPLOYMENT DATA AS INVESTORS
In previous articles, we've written on how Weekly Claims are often an interesting indicator for the trend in economic conditions - for the LONG TERM by pulling up a yearly 2000-2012 chart, and even on a month-to-month basis to spot cycles of economic strength or weakness (such as March-present). The chart below (screenshot from ForexFactory) shows this well:

We haven't written much however, on Non-Farm Payrolls, termed the "biggest economic report of the month" by the financial press and held in high regard by investors and traders. Firstly, we disagree that it is the most important data release of the month - because it is prone to volatile readings and often lags, rather than leads, economic conditions and the market.
The second data release, closely associated with NFPs, is the ADP Jobs Report, designed to give a lead on what NFPs might be. Below are the charts for both ADP and Non-Farm Payrolls, along with the Headline US Unemployment Rate.
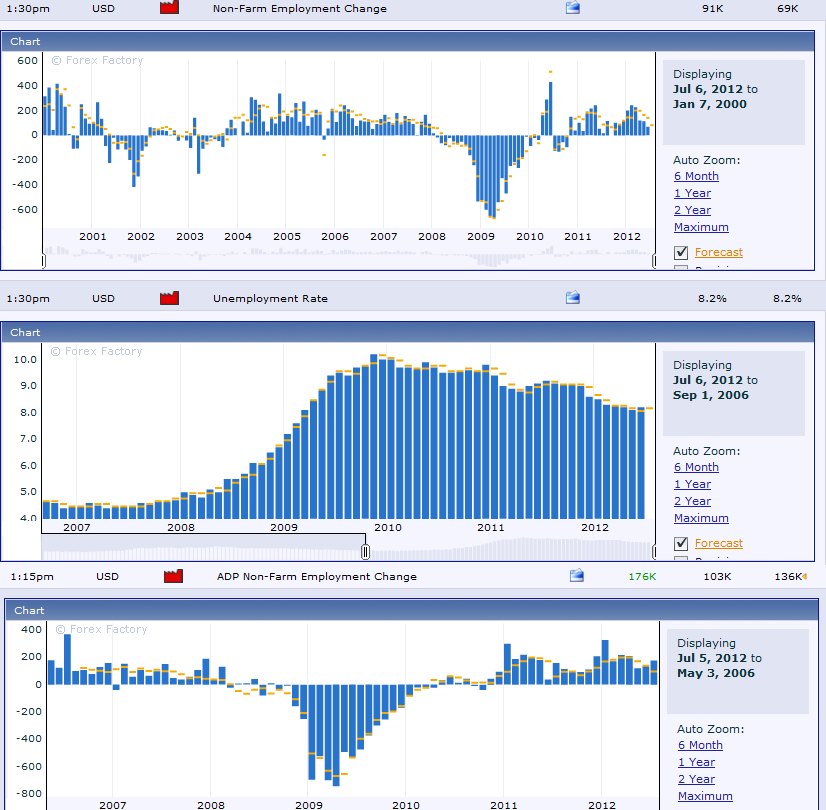
First we'll ask how useful each can be as a leading economic indicator, for use by investors, compared to our favoured survey indicators. For brevity we'll use this latest LONG TERM cycle as an example. Would any have aided in presenting March 2009 as a bottom for global equity markets, by troughing in January 2009, as ISM Manufacturing did?
The middle indicator, the headline US Unemployment Rate, visibly holds little value. It failed to recognise the severity of the downturn until far too late in 2008, and then continued throughout 2009. Only by 2010 was it clear that this indicator has stopped getting worse - by which time equity markets had long since bottomed. For this reason, we are very cynical about headline Unemployment Rates when presented to us in the media - what use is this kind of statistic for investors?
So what about ADP and Non Farm Payrolls? Firstly, at a brief glance, you can tell how volatile these indicators can be. Both are prone to revisions and wild swings (the retrospectively revised versions make these indicators look better - the above data you see is what an investor or trader is presented with in real-time). You will remember that ISM provided ample warning of a deteriorating trend from 2007 onwards. Most PMI data troughed between December 08 and March 09, presenting divergence between the market and economy.
Non-Farm Payrolls meanwhile, using this latest cycle purely as an example, continued to decline - giving the lowest reading in April 2009, months after the ISM. The sheer volatility in the data meant that either a lagging moving average is required, or patience to wait for clear signs of a trend, which were only clear by August 2009. That's not to mention the confusion of the revisions in the data - even the April 2009 reading was revised to look worse, by which time the PMI survey data had swiftly and confidently established a new bullish trend.
The same criticisms can be applied to many other cycles over the years. ADP is a very similar indicator, although appears to be more smooth, and with trends that are far easier to identify in real-time. Our main criticism for ADP is its use in identifying MEDIUM TERM month-to-month trends in economic conditions - it did little to help investors in 2011 (although this is slightly harsh, considering it could have helped investors back into the market last October). Non-Farms, while volatile, did give us far more stark signals to indicate the mid/late-2011 slowdown.
While we have some criticisms for both ADP and Non-Farm Payrolls (and pretty much all Employment related indicators), we're far from casting them off entirely. We just don't regard these indicators as highly as the financial media or large investment institutions do.
Clearly then, for our LONG TERM analysis, we want both ADP and Non Farm Payrolls to be increasing in a trend similar to PMI, even if they're not as useful for predicting changing trends. So what do we think about yesterdays ADP and Claims data? And what about today's big Non-Farm Payrolls data?
YESTERDAY'S ADP AND CLAIMS DATA, TODAY'S PAYROLLS
The Weekly Jobless Claims number came in better than expected at 376k. The previous week's data was revised up to 388k, but this is still lower than the 392k for June 21st. 376k is the lowest headline reading since May, and assuming it is not heavily revised upwards, is good news for the US economy after the difficult ISM data on Monday. If Unemployment Claims have peaked, it stands as a rare positive indicator for the global economy's 2012 outlook - and perhaps gives some credence to the market's rally in the last month.
The ADP Jobs Report also came in better than expected. At 176k, it marked two months in a row of improvement, data that flies in the face of other reports released in that time period. The number of jobs added is less than the start of the year, and while we also need to consider seasonal irregularities from the warm winter, the stats also reflect a disappointing change in trend from the positive early-2012 reports.
So what about Non-Farm Payrolls today? The market will be glued to the number, with most traders on Wall Street expecting something between 100-125k. We also note that this report covers 5 weeks of data, giving a natural bias to be better than last month. We have no estimate to offer, but will be watching closely for revisions in last month's data - as well as any signs of shocks in this month's headline figure.
Anything above 120k would be a tick in the box of "bullish for the MEDIUM TERM trend". Anything less than last month's 69k would be remarkably bearish for that trend. Given the volatility in the data, we doubt anything in between will seriously affect our view - this indicator has so far reflected the MEDIUM TERM bearish trend by peaking in March-April. A negative number would class as a serious threat to the LONG TERM 2009-present bull market when complimented by the weak ISM data.
Given that 2009-present "recovery trend" has never been under so much threat from leading economic data, we have good reason to be cautious heading into today's report.


0 responses:
Post a Comment