


This time last year (February 22nd 2012) we received our first real warning from our favoured leading economic indicators on the health of the underlying global economy.
This year, the warnings come not from the economy, but US Market Breadth indicators.
It should be pointed out that the market breadth signals are useful only as a guide for medium-term trading. They can be used to glean insights into the health of a market rally or decline before the market shows its hand, and while not offering any precise timing methods, they usually give plenty of warning to reposition a trading account or portfolio.
For investors meanwhile, who aren't interested in market timing exactly, knowing when a market is "overcooked" can be useful in avoiding any surprise when the market pulls back. On a whole, for all market participants, it helps to be as informed as possible - preferably as early as possible.
To save some time, here are the articles on how we use these sorts of indicators:
http://bigmacropicture.blogspot.co.uk/2012/10/equities-market-analysis-august-13th.html
http://bigmacropicture.blogspot.co.uk/2012/11/us-market-analysis-november-10th-2012.html
In early October the main indicators peaked and provided warning of a decline. In the November article, the indicators showed clearly the weakness in the market, and it proved worth waiting for oversold conditions before buying the market.
This time around, it may be worth selling into strength on the US indices, depending on your style of trading.
It should be noted that this is entirely separate from our previous concerns that the US market is beyond the fair value. That would be an investment matter, which should play no part in evaluation of trading opportunities related to market or technical indicators.
Here are the warning signs from the various market health indicators:


Our main concern is identifying periods where conditions are "fertile" for letting trades run, and periods where trading volatility necessitates a different strategy. November - February has been attractive for the majority of market participants, but we believe it is almost time for that to end - even if conditions are only mildly less attractive, or if the respite is brief.
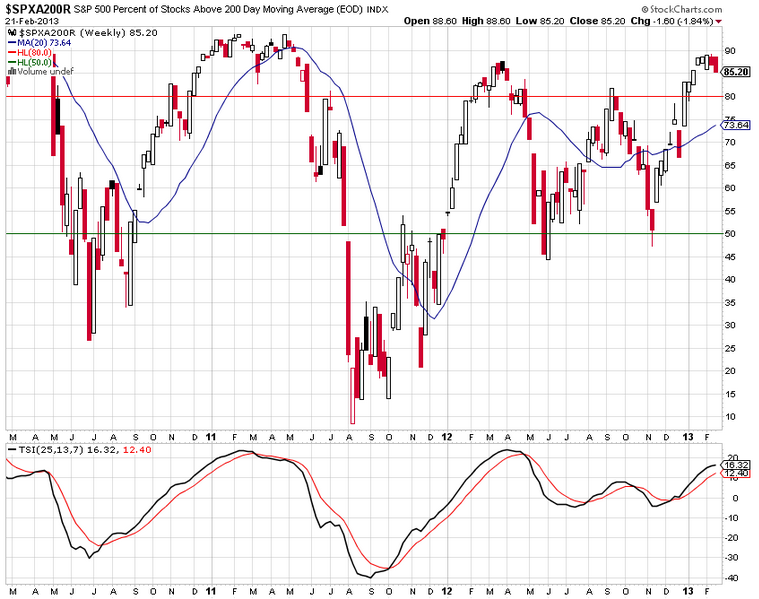
We ask that traders look at the oscillators of the indicators above (and in the case of $BPNYA and $SPXA200R, the occasions where the indicators embed over 70% and 80% respectively).
If you find that your "comfortable" periods over the last few years correlate to the above indicators, you may want to consider taking some profits on market strength, at least.
While this warning is far from a prediction, it is a rational analysis of what has happened in recent years when market breadth has started to break down. There's also no guarantee that the indicators will not avoid more severe deterioration - but it is generally better to acknowledge these risks early. A more severe contraction in the Bullish Percentage and S&P% indicators would serve as confirmation, and you can check those out as they update every day on StockCharts.com.
We hope this proves to be worthwhile analysis, and we'll keep you up to date with any developing trends in the indicators. We'll return with economic analysis after the next round of PMI updates.


